Challenging the 'real' economy


Exchange-traded commodity funds fuel speculative bubble in bourses
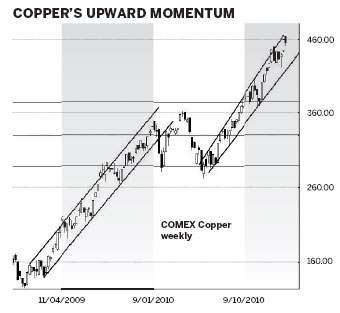
The copper price reached new highs above $460 in COMEX trading and the strong upward trend channel suggests higher prices are achievable. Copper is considered an industrial metal, and pricing is closely linked to fundamental economic growth. In particular, the copper price has been used as a substitute measure for the growth of the Chinese economy. It is generally considered that Chinese demand is underpinning the copper price but this assumption may need closer examination.
The weekly chart of COMEX copper shows three broad features. The first is a sharp rise from around $125 to $340 starting in December 2008 and ending in late 2009. The price activity was confined in a well defined trading channel. This is created by a lower trend line, and a parallel higher trend line. Price developed rally, retreat and rebound behavior using the trend lines as support and resistance levels.
In late 2009 this upward trend ended and developed a very broad sideways pattern. Support was near $285 and resistance near $360. This period included some fast rallies and some fast retreats.
In July 2010 copper began a new upward trend and again traded in a rising trend channel. This was a relatively narrow trading band and prices clustered near the upper edge of the band for extended periods. This indicated growing bullish strength.
This pattern of behavior was very similar to the pattern of behavior in the Shanghai index. It was not exactly the same, but there was a good relationship between Shanghai index strength or weakness and the strength or weakness in the copper price. Analysts watched Shanghai index behavior closely because it was a leading indication of developing changes in the copper price.
In late 2010 this relationship began to change. The middle of November 2010 saw the Shanghai index peak near 3186 before developing a prolonged downward trend moving toward support around 2700. In mid-November 2010 the copper price made an initial retreat to near $380. But then the copper price developed a powerful new upward trend that has reached highs above $460. This is a very strong divergence in behavior. The primary market indicator is the Chinese economy and this is showing weakening demand. The downward trend in the Shanghai index is another indicator of this weakness.
This weakness is supported by a raft of measures taken to moderate economic growth and tackle developing inflation. Increases in interest rates and increases in the bank reserve rate ratios are designed to cool economic activity. Commodity markets, including copper, develop pullbacks when new Chinese tightening measures are announced. These retreats are within the environment of a strongly upward trending market and the well defined trend channel.
Growth in the US remains sluggish so there is a limited increase in demand to replace the planned slowdown in Chinese demand. In the short term, the market believes Chinese tightening measures are bearish for copper and commodities, hence the market sell-off after each new interest rate announcement.
This creates an interesting situation where the fundamental factors driving price do not justify the current price levels. Copper is a good example, but increasingly this behavior is observed in other hard commodities. It is also adding to the level of price increases in some soft commodities including grains and soy beans. This divergence is often a signal of increasing speculative activity in the market.
The speculative activity is assisted by the growth of derivative trading. These are financial instruments that were once the legitimate tools of industry traders. They allowed buyers to lock in and hedge prices. It allowed producers to hedge future production and provide the certainty required for mine expansion. Futures trading plays a vital role in price stability.
The growth of other derivative financial instruments in the commodity markets has increased price volatility and speculative activity. The introduction of exchange-traded commodity funds (ETCF) that are backed by physical holdings has tightened the supply side of the commodity equation. These funds stockpile the commodity for investment purposes. The first of these funds for industrial metals, such as copper, was created late in 2010. There are more copper exchange-traded commodity funds in the pipeline. It is perhaps just a matter of time before these same principles are applied to a soft commodity ETCF. Many believe investors and fund managers will use these ETCFs as a convenient way to play the rise in commodity prices. This is investment fund speculation.
In markets where there is already tight supply the activity of funds, which stockpile metals and remove them from the production chain will produce increased price volatility and increased prices. For copper this pushes upside targets on a technical charting basis toward $510.
This becomes a self-fulfilling situation. Investors are attracted to the rapid appreciation in commodity prices. Their participation in the market using ETCFs reduces the physical supply, and this in turn pushes up the price. Investors are pleased to see the price rise, so they buy more of the ETCFs. This further constrains supply, so prices rise again. This is a true speculative bubble.
It has taken a remarkably short time after the global financial crisis to sow the seeds of the next significant challenge to the 'real' economy created by what some believe is inadequately regulated financial activity.
The author is a well-known international financial technical analysis expert.
(China Daily 02/14/2011 page14)


